The trading community have always had great respect to the Fibonacci methodology in general, and to the Fibonacci retracement strategy more specifically. the famous ratios have been used as a model to predict price action. Unfortunately, same with all the rest of the useless methods out there, this one was no different, at least not in its basic and common practice.

Fibonacci Retracement Strategy
The problem is, not what the literature is telling us, but rather what it is NOT telling us. It’s not telling us the most important piece of information regarding the Fibonacci retracement strategy behavior. We’ve been constantly told (and still are) that there are 3 most important retracement levels (38.2%, 50%, 61.8) that we should all pay very close attention to, whenever price action is approaching either one of them.
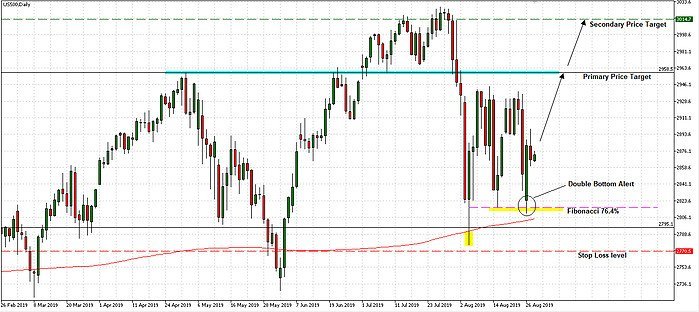
S&P 500 Price Analysis | 28.08.19
Now, that may very well be true. However, it’s not about these 3 key-levels at all. That’s just might be the dark secret that the big banks do not want traders to know. Nevertheless, here it is. There is one key-level that is much more important, far beyond the other three. It is the mighty 76.4%, Also known as “the last line of resort”.
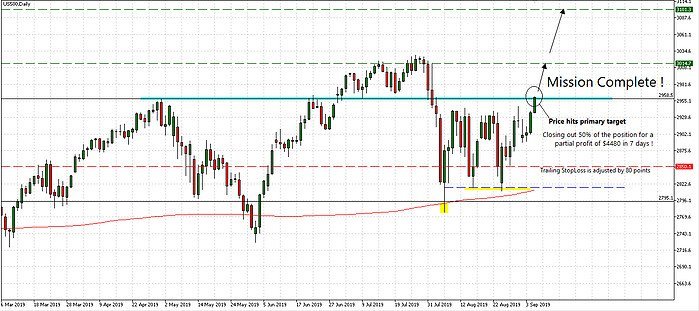
S&P 500 Price Analysis | 05.09.19
The trick here is to completely ignore the famous key levels, as their getting hit by price action, and patiently wait for price to go through all of them till it finally reaches the 76.4% last line of correction. According to our own statistical research, around 50% of all corrections make it to the very edge of their capacity, which is the 76.4%. No wonder why the conventional notion of trading the other key-levels doesn’t really work out for anyone. Now you know why. Filtering out only those trades that make it to the 76.4% in a double bottom pattern, could be a real game changer for any trader, regardless of his trading experience.
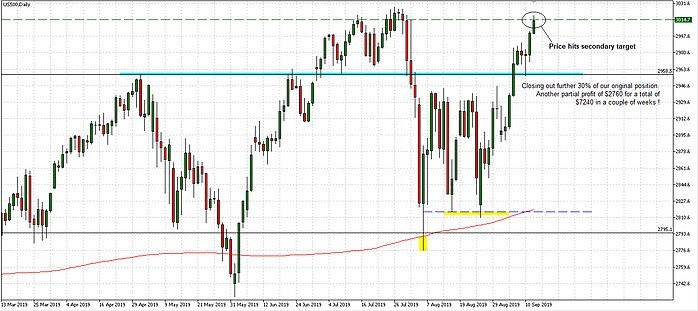
S&P 500 Price Analysis | 12.09.19
From the Fibonacci retracement strategy point of view, there is only one thing that is better than a 76.4% price reaction, and that is two 76.4% price reactions. Meaning, a double bottom pattern (or double top), which can be massively indicative of price reversal.
We are always on the lookout for these types of trading opportunities. We identify them early on and take appropriate action. This real-time case study on the S&P 500 is just another example of this reality. That is how we roll… 😉
Shortcut